Two groups of people
Everyone who started our free intake assessment, and a closer look at the 229 who went on to join one of our programs.
When someone signs up to the 1HP app, they answer a short intake: their age and sex, how long they have had pain, where it hurts on a body map, whether they have nerve symptoms, 14 medical screening questions, and the QuickDASH function survey. By November 4, 2026, 6,842 people had answered at least part of it. We call them the intake group.
229 of them joined one of our two lifetime programs: 150 in Power Leveling, where a 1HP expert coaches each member, and 79 in the self-guided Wrist Pain Troubleshooter. We call them program members. We know more about them, including repeat surveys, daily tracking and how they did over time. They are the same people described in The 1HP Clinical Outcomes Report 2026. The counts differ slightly because this report uses data extracted on November 4, 2026, a few days later.
| What we know | Intake group | Program members |
|---|---|---|
| People | 6,842 | 229 |
| Age, sex, how long they had hurt, where it hurts | Yes | Yes |
| Nerve symptoms and medical screening | Yes | Yes |
| QuickDASH function score at the start | Yes | Yes |
| Hobbies, work and fear of movement | Work only | Yes |
| Repeat surveys showing who improved | No | 148 members |
Age
Most people who came to us were young adults. Half were 23 or younger.
Age at intake
The intake group was young because of who our content reaches. Most people find 1HP through material about gaming, typing and computer work, and those audiences skew young. The age mix here describes the people who came to us, not everyone who gets wrist pain.
Program members were older: a median of 31, with 74% aged 25 to 44, and none under 18. Roughly 1 in 10 people aged 35 to 44 who started the assessment went on to join a program, against about 1 in 70 of those aged 18 to 24. Older people were also more likely to have had pain for a long time (Chapter 04).
Men and women
Most people who came to us were men. The women were older, had hurt for longer, and started with worse function.
Share of each age group who were women
Women were about 1 in 20 of the people under 25 who came to us, but about half of those 45 and older. That pattern probably says more about who our gaming and computer content reaches than about who gets wrist pain.
The women who came to us had a heavier load of symptoms. 43% had been in pain for more than a year, compared with 31% of men. Their average QuickDASH, a 0 to 100 survey of how hard everyday tasks are with your arm, wrist and hand [1], was 31.3, against 17.2 for men. They reported thumb pain more often too: 47% marked the back of the thumb, against 32% of men.
Program members were 85% men and 14% women (226 who gave their sex). The same gap showed up at the start of the program: women began at an average QuickDASH of 40.1 and men at 31.1, and 32% of women started with severe disability (50 or more), against 15% of men.
Women and men side by side
| Intake group | Women | Men |
|---|---|---|
| People | 863 | 5,714 |
| Median age | 31 | 23 |
| Aged 45 or over | 27% | 4% |
| In pain for less than a month | 24% | 40% |
| In pain for more than a year | 43% | 31% |
| Pain on the back of the wrist | 55% | 52% |
| Pain on the palm side of the wrist | 52% | 46% |
| Pain on the back of the thumb | 47% | 32% |
| Pain when bending the thumb | 44% | 33% |
| Average QuickDASH, people not in a program | 31.3 (n=753) | 17.2 (n=4,792) |
How long they had hurt
A third of people who started our assessment had been in pain for more than a year. Among those who joined a program, it was two thirds.
How long they had been in pain
The intake group split into two kinds of people. 38% came within the first month of their pain, often in the first week. Another 33% had been in pain for more than a year. Program members were mostly the second kind: 87% had been in pain for more than 3 months and 65% for more than a year.
The older people were, the longer they had usually been in pain. Almost half of people under 25 came to us within a month of their pain starting. From 35 onward, about half had been in pain for more than a year.
In pain for more than a year, by age
Pain duration by age, all bands
| Age | Under 1 month | 1 to 3 months | 3 to 12 months | Over a year |
|---|---|---|---|---|
| Under 18 (728) | 58% | 13% | 15% | 14% |
| 18 to 24 (3,033) | 46% | 12% | 15% | 26% |
| 25 to 34 (2,024) | 29% | 11% | 19% | 40% |
| 35 to 44 (546) | 18% | 13% | 20% | 48% |
| 45 to 54 (191) | 14% | 13% | 25% | 49% |
| 55 and over (289) | 9% | 14% | 24% | 53% |
Where it hurts
The back of the wrist was the most common place to hurt, and about half of people hurt in three or more places.
Our intake asks people to mark where they hurt on a map of eight regions of the wrist, hand and forearm. Each region matches a group of muscles and tendons that do a particular job, so it shows which movements are likely to be painful. Pick a region on the map to see where it is and how many people marked it.
Share of people with pain in each region


Back of the wrist
The wrist extensors run along the back of the forearm. They bend the wrist back and lift the fingers, so pain often shows up when lifting the fingers or bending the wrist upward.
52% intake · 71% membersunder 18: 52%, 55 and over: 48%
Palm side of the wrist
The wrist flexors run along the palm side of the forearm. They grip and bend the wrist down, so pain often shows up when gripping.
47% intake · 64% membersunder 18: 41%, 55 and over: 47%
Fingers
Pain in the fingers themselves, on the palm side, the back, or both. It often shows up when typing, clicking or doing other fine movements.
37% intake · 30% membersunder 18: 36%, 55 and over: 45%
Back of the thumb
The thumb extensors run along the back and side of the thumb into the wrist. They lift the thumb away from the hand.
35% intake · 36% membersunder 18: 26%, 55 and over: 49%
Bending the thumb
The thumb flexors sit on the palm side of the thumb and wrist. They bend the thumb, grip and pinch, so pain often shows up at the base of the thumb when gripping or pinching.
35% intake · 36% membersunder 18: 25%, 55 and over: 55%
Pinky side, back
The ulnar-side extensors run along the back of the forearm on the pinky side. Pain often shows up when twisting the wrist or lifting the fingers.
30% intake · 24% membersunder 18: 29%, 55 and over: 29%
Pinky side, palm
The ulnar-side flexors run along the palm side of the forearm on the pinky side. Pain often shows up when gripping or bending the wrist down.
27% intake · 30% membersunder 18: 23%, 55 and over: 23%
Pinky and ring finger
The pinky flexors bend the pinky and ring finger. Pain sits in those fingers or the forearm muscles that move them, often when gripping.
24% intake · 16% membersunder 18: 24%, 55 and over: 19%
Wrist pain rarely stayed in one place. Only a quarter of the intake group marked a single region, and program members marked three regions on average. Program members reported wrist pain more often than the intake group: 71% on the back of the wrist and 64% on the palm side, against 52% and 47%.
Thumb pain became more common with age. Pain when bending the thumb rose from 25% of under-18s to 55% of people 55 and over, and pain on the back of the thumb from 26% to 49%. Women also reported thumb pain more often than men (Chapter 03).
Pain when bending the thumb, by age
Every region by age
| Region | Under 18 | 18–24 | 25–34 | 35–44 | 45–54 | 55+ |
|---|---|---|---|---|---|---|
| People | 510 | 2,447 | 1,814 | 488 | 157 | 218 |
| Wrist extensors | 52% | 50% | 54% | 56% | 62% | 48% |
| Wrist flexors | 41% | 45% | 49% | 48% | 54% | 47% |
| Fingers | 36% | 38% | 38% | 33% | 36% | 45% |
| Thumb extensors | 26% | 32% | 37% | 38% | 43% | 49% |
| Thumb flexors | 25% | 32% | 37% | 37% | 41% | 55% |
| Ulnar-side extensors | 29% | 30% | 30% | 33% | 32% | 29% |
| Ulnar-side flexors | 23% | 26% | 29% | 31% | 34% | 23% |
| Pinky flexors | 24% | 25% | 24% | 24% | 22% | 19% |
Nerve symptoms
More than half reported numbness, tingling or other nerve symptoms, most often along the ulnar nerve on the pinky side of the hand.
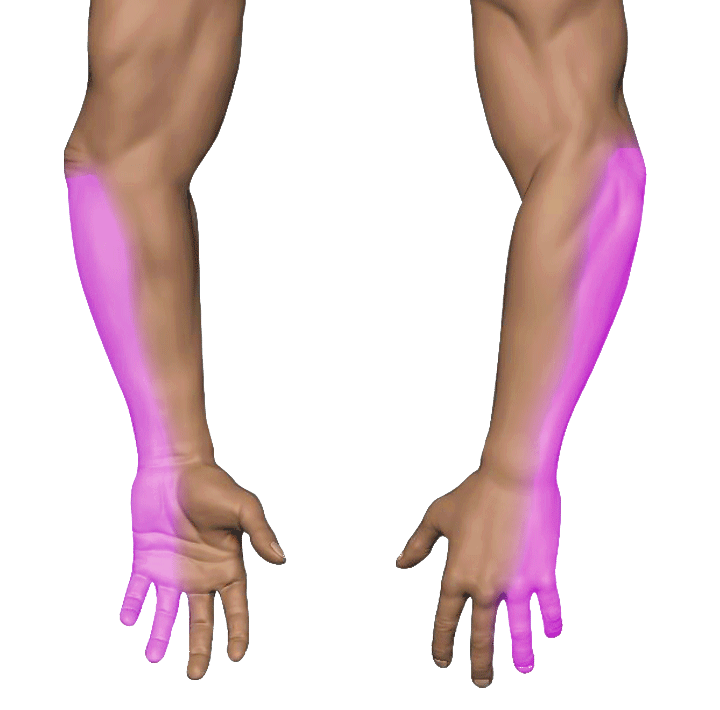
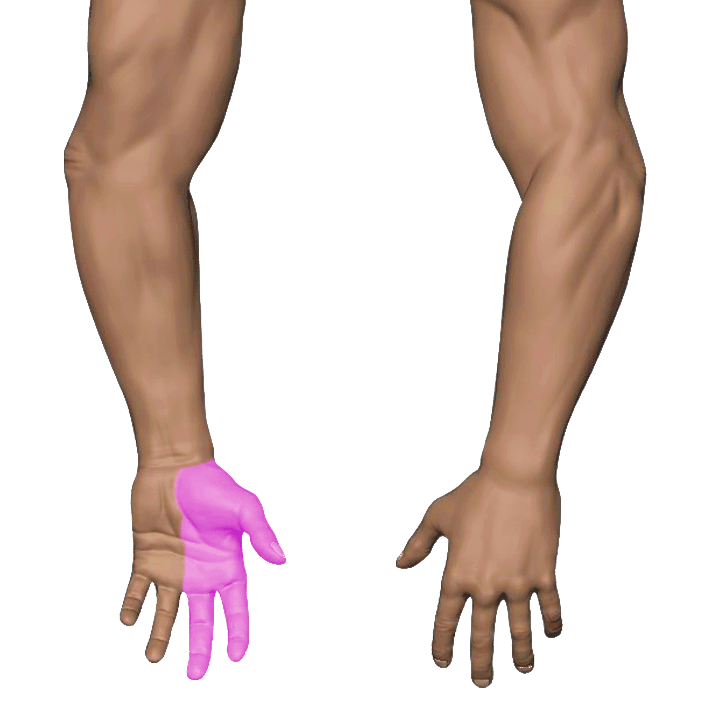
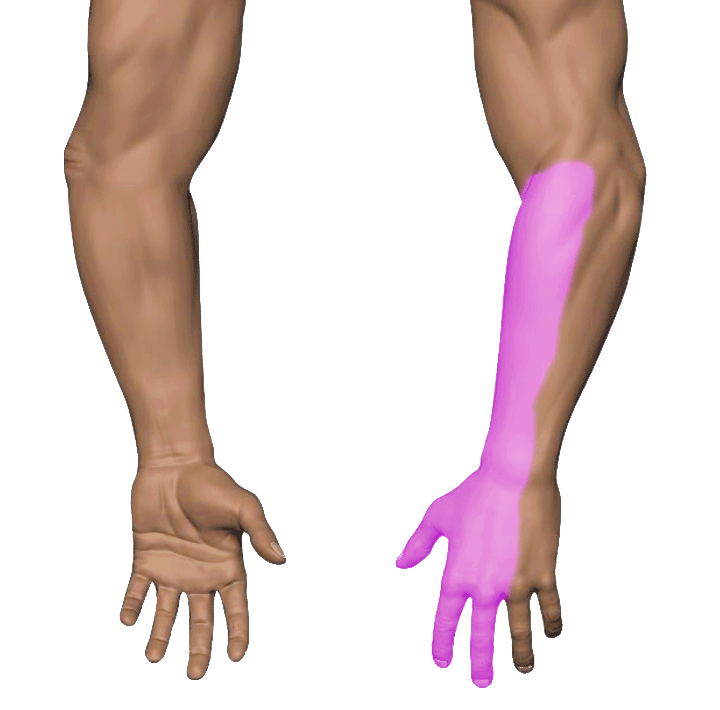
Three nerves supply the hand, and the intake asks which areas tingle or go numb. The ulnar nerve runs to the pinky and ring finger, the median nerve to the thumb, index and middle fingers (it is the nerve involved in carpal tunnel syndrome), and the radial nerve to the back of the hand and thumb. People could mark more than one.
Which nerve, among people with nerve symptoms
Ulnar nerve
The pinky, half of the ring finger and the side of the hand below the pinky. Tingling often gets worse when the elbow stays bent.
59% intake · 69% members
Median nerve
The palm side of the thumb, index and middle finger, and half of the ring finger. This is the nerve involved in carpal tunnel syndrome, and symptoms may wake people at night.
47% intake · 56% members
Radial nerve
The back of the forearm and hand, the thumb and the first two or three fingers.
44% intake · 43% members
Carpal tunnel syndrome is the nerve problem most people have heard of, but in our data the median nerve came second. Ulnar symptoms on the pinky side were the most common, in both groups.
Nerve symptoms sound alarming, but among program members they did not predict a worse result. Members with nerve symptoms improved more on average than members without them (Chapter 08).
How much it gets in the way
Pain got in the way of hobbies more than work. Program members started at 62 out of 100 for difficulty with gaming, music and sport, and 45 for work.
We measure function with the QuickDASH, an 11-question survey about how hard everyday tasks are with your arm, wrist and hand [1]. It scores from 0 (no difficulty) to 100 (unable to do most tasks). Optional modules ask the same about work and about sport, music or other hobbies.
Program members at the start
Hobbies took the biggest hit
For program members, gaming, music and sport were harder than work, and work was harder than everyday tasks. That suggests many people kept working through their pain while cutting back on the things they did for fun. Gaming was the main hobby for 63% of members aged 18 to 24 and 60% of those aged 25 to 34, falling to 40% at 35 to 44.
Pain came with use
Program members' worst pain during activity averaged 3.8 out of 10 in their first two weeks of tracking (124 members), while pain at rest averaged 1.3. For most people, the problem was what their hands could not do without hurting, not constant pain.
Fear of movement was common
On the Fear-Avoidance Components Scale [2], which measures how much people avoid activity because they fear pain or damage, program members started at 46.4 out of 100. 65% scored in the moderate range or higher (above 40).
People who joined a program had more trouble
The intake group was milder than program members: an average QuickDASH of 19.2 for people who did not join a program, against 32.6 for members. People with more severe and longer-lasting problems were the ones who signed up for help.
Who improved most
Among program members with a follow-up survey, women, people with two pain regions, and people whose pain was under a year old did best. Age made little difference.
148 program members completed a QuickDASH at least 28 days after their first one. We counted an improvement of 8 points or more as meaningful, the most common threshold in the research we follow [3, 4]. Both programs are combined here; the Clinical Outcomes Report compares them, and expert-coached Power Leveling members did much better (72% vs 33%).
Average improvement in points, by group
By pain region
| Region | Members | Points improved | Improved 8+ |
|---|---|---|---|
| Wrist flexors | 96 | 16.9 | 71% |
| Wrist extensors | 106 | 15.5 | 69% |
| Ulnar-side extensors | 34 | 16.4 | 59% |
| Ulnar-side flexors | 48 | 15.1 | 58% |
| Thumb flexors | 57 | 13.9 | 58% |
| Fingers | 44 | 10.8 | 52% |
| Thumb extensors | 55 | 10.4 | 47% |
| Pinky flexors | 23 | 10.7 | 39% |
Reading these differences
Women improved more, but they also started worse. Women began at an average QuickDASH of 40.1, against 31.1 for men, and people who start with more difficulty have more room to improve. Some of that is also expected anyway: people tend to join when their symptoms are at their worst, and scores drift back toward normal over time. This is called regression to the mean [5]. Only 22 women had a follow-up survey, so this result could change a lot with more data.
Age made little difference. Members from 18 to 44 improved by similar amounts. Only 10 members aged 45 or over had a follow-up, too few to say whether older people do differently.
Long-standing pain still improved. 58% of members who had been in pain for more than a year reached a meaningful improvement. In Power Leveling alone, that figure was 69% (Clinical Outcomes Report, Chapter 07).
Pain in a single region did worst, but only 8 members had it. Thumb and finger pain improved less than wrist pain.
These are unadjusted comparisons, and the groups differ in other ways, including which program they were in. We looked at many groups, so a few differences will look important by chance. Treat this chapter as a guide to questions, not answers.
What this data can't tell us
Only 22 women in our programs had a follow-up survey. Several findings in this report rest on small groups like that one.
- Who found us.
People reached 1HP mostly through content and ads about gaming, typing and computer work. This report describes the people who came to us, not how common wrist and hand pain is in the population, or who gets it. The high share of young men in particular reflects our audience.
- Self-reported answers.
Age, sex, pain duration, pain regions, nerve symptoms and screening answers are what people entered in the app. Nobody was examined, and none of these are diagnoses.
- Not everyone answered everything.
Each percentage uses the people who answered that question. People who skipped questions may differ from those who answered.
- Data entry errors.
We left out ages outside 13 to 100 and body weights outside 70 to 500 lb as likely typing errors. For people outside our programs, the QuickDASH used is the latest score on their profile, which is almost always their intake score.
- Small groups.
Only 22 women, 10 members aged 45 or over and 8 members with a single pain region had a follow-up survey. Results for groups this small can change a lot with a few more people.
- Unadjusted comparisons.
Chapter 08 compares groups without adjusting for differences between them, such as starting severity or program. Differences are associations, not causes.
- Who ran the analysis.
The data were collected inside a paid program by the company that runs it, and the authors are its co-founders.
- No outside review.
This is an internal analysis of de-identified data. It has not been peer reviewed or reviewed by an ethics committee.
Methods and references
User accounts reviewed, of which 6,842 had answered at least part of the intake.
Design
A descriptive study of data collected routinely in the 1HP app, with a retrospective look at outcomes among program members, reported following the STROBE guidelines for observational studies where they apply [6]. Data were extracted on November 4, 2026.
Who was included
Intake group: every account that answered at least one of the age, sex, pain duration or pain region questions. Of 8,510 accounts, 6,842 qualified. Staff, administrator, expert and test accounts were excluded. Program members: every member of the two lifetime programs, Power Leveling and the Wrist Pain Troubleshooter, with the same exclusions; 229 people, of whom 227 also appear in the intake group.
Measures
Age, sex (male, female or prefer not to answer), pain duration (six options from less than a week to more than a year), pain regions on an eight-region body map, nerve symptoms by nerve, 14 medical screening questions, and the QuickDASH [1] with its optional work and sport or performing-arts modules. For program members we also used the Fear-Avoidance Components Scale [2], daily pain ratings from the app, and main hobby, coded from the activities members logged.
Analysis
We report counts, percentages, means and medians, each with the number of people it is based on. Program members' baseline QuickDASH was the first survey within 90 days before joining or any time after. Improvement was the baseline score minus the latest score at least 28 days later, with 8 points as the threshold for a meaningful change [3, 4]. This report is descriptive: we did not test differences between groups for statistical significance.
Data handling, funding and conflicts of interest
Records were de-identified on the server before analysis, and only grouped numbers are published. The analysis was funded internally by 1 Healthpoint Inc. Elliot Smithson and Matthew Hwu are co-founders of 1 Healthpoint Inc., which sells both programs, and both coach members in Power Leveling.
Context
Repetitive strain injury covers many upper-limb conditions with overlapping symptoms, and it is common among people who use computers heavily [7]. This report describes the people who came to an online program for those problems, most of them young people who game and use computers.
Related report
The 1HP Clinical Outcomes Report 2026 compares how members of the two programs did over time.
How to cite this report
Smithson E, Hwu M. The 1HP Wrist and Hand Pain Report 2026. 1 Healthpoint Inc.; November 2026. https://app.1-hp.org/ebooks/The%201HP%20Wrist%20and%20Hand%20Pain%20Report%202026/
References
- Beaton DE, Wright JG, Katz JN; Upper Extremity Collaborative Group. Development of the QuickDASH: comparison of three item-reduction approaches. J Bone Joint Surg Am. 2005;87(5):1038–1046. doi:10.2106/JBJS.D.02060
- Neblett R, Mayer TG, Hartzell MM, Williams MJ, Gatchel RJ. The Fear-avoidance Components Scale (FACS): development and psychometric evaluation of a new measure of pain-related fear avoidance. Pain Pract. 2016;16(4):435–450. doi:10.1111/papr.12333
- Mintken PE, Glynn P, Cleland JA. Psychometric properties of the shortened disabilities of the Arm, Shoulder, and Hand Questionnaire (QuickDASH) and Numeric Pain Rating Scale in patients with shoulder pain. J Shoulder Elbow Surg. 2009;18(6):920–926. doi:10.1016/j.jse.2008.12.015
- Sorensen AA, Howard D, Tan WH, Ketchersid J, Calfee RP. Minimal clinically important differences of 3 patient-rated outcomes instruments. J Hand Surg Am. 2013;38(4):641–649. doi:10.1016/j.jhsa.2012.12.032
- Barnett AG, van der Pols JC, Dobson AJ. Regression to the mean: what it is and how to deal with it. Int J Epidemiol. 2005;34(1):215–220. doi:10.1093/ije/dyh299
- von Elm E, Altman DG, Egger M, Pocock SJ, Gøtzsche PC, Vandenbroucke JP; STROBE Initiative. The Strengthening the Reporting of Observational Studies in Epidemiology (STROBE) statement: guidelines for reporting observational studies. Lancet. 2007;370(9596):1453–1457. doi:10.1016/S0140-6736(07)61602-X
- van Tulder M, Malmivaara A, Koes B. Repetitive strain injury. Lancet. 2007;369(9575):1815–1822. doi:10.1016/S0140-6736(07)60820-4
Sound like you?
Book a free consultation with one of our experts to talk through your wrist and hand pain. If you would rather go at your own pace, the Wrist Pain Troubleshooter gives you the same app, self-guided.